Linear Regression
Variables:
Age: age of the person
BMI: body mass index
Sex: female (0) or male (1)
Children: number of children
Smoker: smoker (1) or non-smoker (0)
Region: southwest (3), southeast (2), northwest (1), northeast (0)
Code To Generate The Chart
note: this was generated in the app.py program
def update_graph(selected_dropdown):

    #dropdown = {'Age':'age', 'Sex':'sex', 'BMI':'bmi',
    'Children':'children','Smoker':'smoker', 'Region':'region'}
    for i in selected_dropdown:
        if i == "age":
            dfx = df["age"]
        elif i == "sex":
            dfx = df["sex"]
        elif i == "bmi":
            dfx = df["bmi"]
        elif i == "children":
            dfx = df["children"]
        elif i == "smoker":
            dfx = df["smoker"]
        else:
            dfx = df["region"]
        dfx = np.array(dfx)
        dfx = dfx.reshape(-1,1)

        #results = evaluate_model(dfx, dataY, model)
        #print("MAE (mean) and MAE (stdev): ", np.mean(results),
        np.std(results))
        model = HuberRegressor()
        model.fit(dfx, df["charges"])
        x_range = np.linspace(dfx.min(), dfx.max(), 100)
        y_range = model.predict(x_range.reshape(-1,1))
        figure3 = px.scatter(data,x=df[f"{i}"], y=df["charges"])
        figure3.add_traces(go.Scatter(x=x_range,
        y=y_range, name = "Regression Fit"))
    return figure3
Linear Regression Summary (using the ‘statsmodels.api’ module):
Script Used to Generate the Summary
Summary
What is a Linear Regression?
“Simple linear regression lives up to its name: it is a very straightforward simple linear approach for predicting a quantitative response Y on the basis of a single predictor varible X” - ISLR - James, Witten, Hastie, and Tibshirani
Mathematical Formula:
Random Forest
What is a Random Forest?
“Random Forests grow many classification trees. […] Each tree gives a classification, and we say the tree ‘votes’ for that class. The forest chooses the classification having the most votes (over all the trees in the forest).” - Breiman and Cutler
Code Used To Generate The Model:
def get_models():
    models = dict()
    #exploting ratios from 10% to 100%
    for i in arange(0.1, 1.1, 0.1):
        key = "%.1f" % i
        #setting the max samples to none
        if i == 1.0:
            i = None
        models[key] = RandomForestRegressor(max_samples = i)
    return models

def evaluate_model(model, x, y):
    #defining the evaluation procedure
    cv = RepeatedKFold(n_splits = 10, n_repeats = 3,
    random_state = 1)
    '''
    MAE
    scores = cross_val_score(model, dataX, dataY,
    scoring = "neg_mean_absolute_error",
    cv = cv, n_jobs = 1, error_score = "raise")
    '''
    #MSE
    scores = cross_val_score(model, dataX, dataY,
    scoring = "neg_mean_squared_error",
    cv = cv, n_jobs = 1, error_score = "raise")

    return np.absolute(scores)

models = get_models()
results, names = list(), list()

for name, model in models.items():
    #evaluate the model
    scores = evaluate_model(model, dataX, dataY)
    #storing the results
    results.append(scores)
    names.append(name)
    #summarizing the performance
    '''
    MAE
    print("Mean MAE scores and STD",
    name, mean(scores), std(scores))
    '''
    #RMSE  - getting the square root of the MSE
    print("RMSE scores and STD", name,
    mean(np.sqrt(scores)))

ans = np.sqrt(results)

#converting the ans variable to a list in order to plot it with
#the names list - otherwise it won't run

ans = list(ans)

#ans is only needed to run the RMSE plot
#if only running the MAE you don't need the
#sqrt() function nor the ans variable

plt.boxplot(ans, labels = names, showmeans = True)
plt.show()
Citation - Machine Learning Mastery
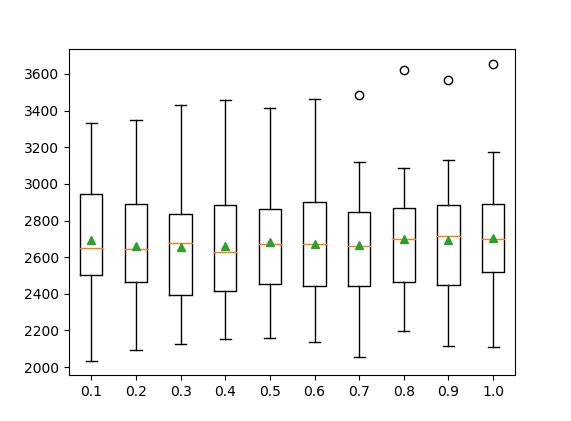
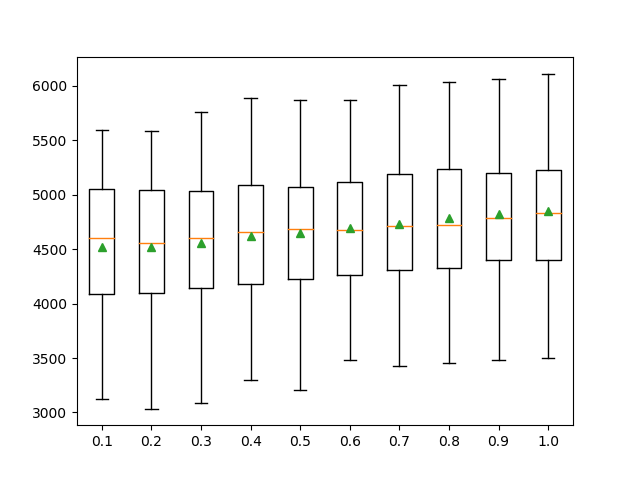
Random Forest Results
MAE-Random Forest | RMSE-Random Forest
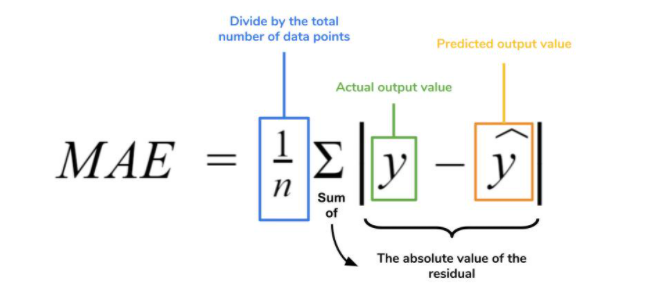
Mean Absolute Error
Mathematical Formula for MAE:
MAE Plot
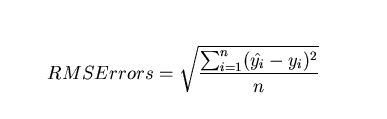
Root Mean Squared Error
Mathematical Formula for RMSE:
RMSE Plot
Download Random Forest Model: random_forest.py