R Analysis
View or download the R PDF (Generated with R Markdown): R PDF
Download RMD file: .RMD file | View from Browser: .RMD file
Jupyter Notebook Regression: Download PythonRegression.ipynb
Jupyter Notebook PDF: PythonRegression.PDF
If you would like to run the reportr.rmd file, make sure that you have R, RStudio, and a LaTeX renderer in your computer - i.e. MiniTeX or TinyTeX.
Otherwise you could render an HTML document instead of a PDF.
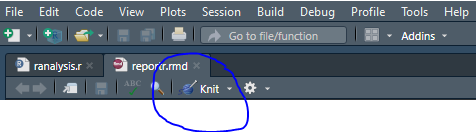
How to run?
If you have RStudio - just hit Knit and the PDF should pop up.
Differences between Python and R
I am not going to into the specifics of the languages, but only the differences when running Linear Regressions and Random Forests.
As you can see R offers a more straight-forward approach to building the models - but it comes with a performance cost.
To run a simple regression model in R:
Note: Make sure that if you have categorical data you convert it to numeric values.
###### Converting to Numeric Variables ######
sex <- ifelse(data["sex"] == "female", 0, 1)
smoker  <- ifelse(data["smoker"] == "yes", 1, 0)
region <- as.numeric(data$region)

##### Replacing columns in the Data ######
data["sex"] <-  sex
data["smoker"] <-  smoker
data["region"] <- region
Using the lm() function:
Response variable: Y (charges)
Predictor variable: X (age)
#note in R it is allowed to have variable names with `.` in between words
example.model <- lm(charges ~ age, data = data)
To get the Summary - use the summary() function:
summary(example)
Random Forest in R
If you want to separate the data in training set and test set:
Remember to always set a seed in order to replicate results.
###### Random Forest Model ######
set.seed(100)

#setting a train and test set
train <- sample(nrow(data), 0.8*nrow(data), replace = FALSE)
trainset <- data[train,]
testset <- data[-train,]
Running and plotting the model
random.forest1 <- randomForest(charges ~ ., data = trainset, ntree = 500, mtry = 6,
                               importance = TRUE)
plot(main = "Random Forest Errors vs. Number of Trees", random.forest1)